With years of data from professional Dota 2 in our hands, we take a look at closely games adhere to a normal distribution, also known as the bell curve.
If you have been through a basic statistics class, you probably have come across the term ‘normal distribution’ or ‘bell curve’. In case you need to jog your memory however, a standard normal distribution, which is a normal distribution with the average at 0 and standard deviation as 1, is shown below. The term ‘bell curve’ comes from the shape of the curve, which is a bit like a bell. We will soon make a connection between normal distribution and professional Dota 2. Hang in there!
Each of the shaded regions indicate the number of standard deviations. Standard deviation (σ) is a measure of how spread out numbers are in a dataset.
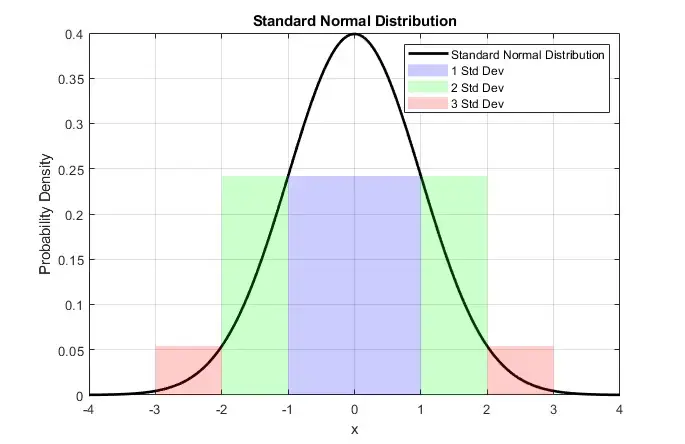
This is how much data is contained within each of the three standard deviations shown above -
1 Standard Deviation (±1σ): About 68% of the data falls within this range.
2 Standard Deviations (±2σ): About 95% of the data is contained within two standard deviations.
3 Standard Deviations (±3σ): Approximately 99.7% of the data lies within three standard deviations.
So three standard deviations are typically enough to include nearly all the data. That is what most normal distributions will show.
But why is the bell curve widely used in statistics, and how can we apply it to professional Dota 2? The normal distribution curve is popular because there are many examples in life which fall in a similar pattern. Parameters such as the heights of large populations as well as their IQ numbers tend to show distribution similar to a bell curve – high density around the average and tapering towards both sides. The question in our case is – do Dota 2 games follow the same trend?
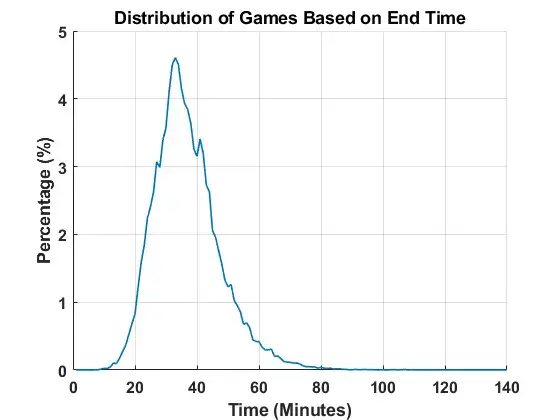
For that, we look at the 42,947 games of professional Dota 2 played from the release of Dota 2 patch 7.00 up to the 28th of October on Dota 2 patch 7.37d. This is what the data looks like, with the percentage indicating the number of games that end at a certain minute mark. The maximum percentage of games is at the 33rd minute mark, and there is s small peak at the 41st minute mark. The average for this dataset is 37 minutes 24 seconds with a standard deviation of 10 minutes 45 seconds. It has the shape of bell which a kindergartener might draw, but as a whole, it doesn’t resemble a normal distribution curve. The biggest deviation comes from the fact that the tail on the right is longer than the tail on the left, which is expected since games can go very long, but the shortest a game can be in theory is 0 minutes (technically, it could be negative for Dota if the game ends before the 0 minute mark is reached!). The question now is, how far is the data from achieving a normal distribution curve?
There are two parameters to determine deviation from the normal distribution curve – ‘skewness’ and ‘kurtosis’, which can be explained through the graphs below.
Skewness is how asymmetric the data is around the mean – a negative skewness indicates a longer left tail while a positive skewness indicates a longer right tail. For Dota 2, the data will always be positively skewed, owing to a few games going way longer than the average game length, which gives the data a much longer right tail. If that skewness is more than 1 (calculations for which can be found in a statistics book!), the data is said to be highly asymmetric and not approximated very well by a normal distribution.
Kurtosis sheds light on how spread out or concentrated a set of data is. A normal distribution has a kurtosis value of 3. Higher than that means the data is more concentrated around the average game duration. In Dota 2 terms, it would mean the majority of the games fall very close to the average. A kurtosis of lower than 3 indicates that the games are more spread out; even though the average might fall at, let’s say, 30:00, there can be a significant number of games ending at 20-minute mark as well as the 40-minute mark, setting the average at 30 minutes. That is exactly what you want in Dota 2 games – a more spread out data set, in which multiple strategies are feasible.

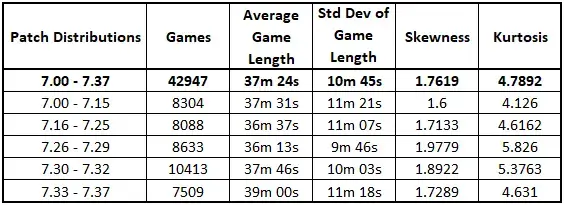
Now that we have learned these statistical terms, it is time to put them to good use. The table below shows the data from patch 7.00 to patch 7.37 divided into five groups, with the average duration, standard deviation, skewness and kurtosis for each group shown separately along with the parameters for the entire data set. The numbers reveal some fascinating stuff. The number of games, average game length and standard deviation of game lengths were obtained from datDota.
Average game length – Even with a plethora of different Dota 2 patches and metas, the average game length stayed between 36 and 38 minutes for the first four sets of data, which is over 35,000 games combined! A specific meta may seem fast paced or very slow, but it is always balanced out by subsequent ones reversing the trend. But for it to fall into such a small window is no small feat. IceFrog and Valve have found the right knobs to turn to make the long-term data fall into that window.
Skewness – The skewness is positive for all groups, which is not a surprise as discussed previously. All of them, though, are above 1, which shows a significant deviation from a normal distribution. As it turns out, Dota 2 games do not closely match a bell curve. The groups with the higher values of skewness are the ones in which more games ended up going past the 60 minute mark, which audiences always enjoy experiencing once in a while.
Kurtosis – The Kurtosis values for all five groups are over 3 and actually even over 4, which shows that a higher percentage of games are concentrated near the average game duration rather than more spread out. A simple way to think about it is the average of 29 and 31 is 30, as is the average of 20 and 40. The Dota 2 data is similar to the first case, which means there are fewer games that deviate away from the average game length and more which are closer to the average.
What is the overarching takeaway from this statistics class? The first one is that mathematics can be fun when applied to something interesting like Dota 2! But in terms of professional games, the data cannot be mimicked by a normal distribution. It is always asymmetric towards the right hand side, and has games concentrated closer to the average game length. But this recipe has worked quite well for professional Dota 2, which continues to garner viewers even with decreasing prize pools for The International. The majority of games are not too short, but not overly long either, which is exactly what you want as a viewer.

